
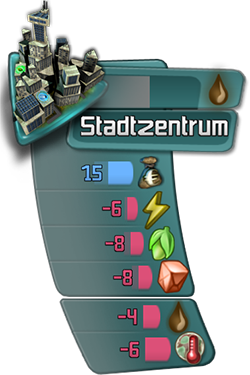
Here you can see the Infopanel from the lower left part of the screen and how it shows the individual values of some energy power stations in the game. At the very top it shows the produced resources in blue. The second value is the costs which fall due every week.
The Infopanel makes these values easily comparable when you are opening the buildring we introduced in Devblog #4. There you can see a constructs total production and consumption before placing it.
 When hovering the planet this panel is trimed to the production value until you click at a certain construct to learn more about its internals. Now you will have relative values often influenced by other buildings and the the field qualities of the land you’re about to place it on or near by.
Air und Ground Pollution
At the bottom you will always have ground pollution and at last air pollution which stands for the emission of greenhouse gases and leads to global warming. Soil pollution is located on every field and therefor also shown on the top of the infopanel close to the field triangle.