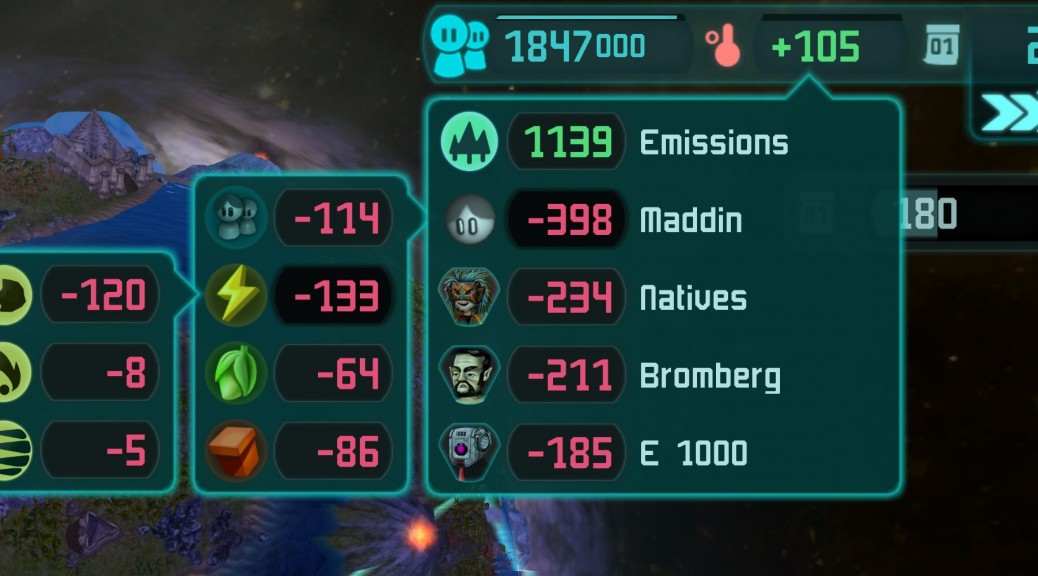
Emission Statistics
By clicking the global emissions display on the top right you get some details on the emission sources. Currently this is hard to understand and even a bit buggy. So Jens did a redesign of it that makes it a lot simpler and easier to understand. Have a look at the screenshot above.
On the first level it displays the current compensation of global emissions and the emissions caused by every player. You can drill down each of them to find out what type of building causes the most emissions. In the example my coal power plants cause 120 of 398 emissions which is more than a quarter.
Production Details
This one is still work in progress. We realized that it’s sometimes hard to understand why a building produces a certain amount of resources. The screenshot shows details on the production of a industrial farm:
- 24 food is it’s base production
- 4 additional food are produced by an upgrade
- 6 food are added because the farm is built on farmland
- 3 food are added by a nearby cattle breading. This influence is limited to a maximum of 4
- 11 food are lost because the field is highly polluted
Aside from this we received some bug reports by the community and did a Steam update with the fixed version.


