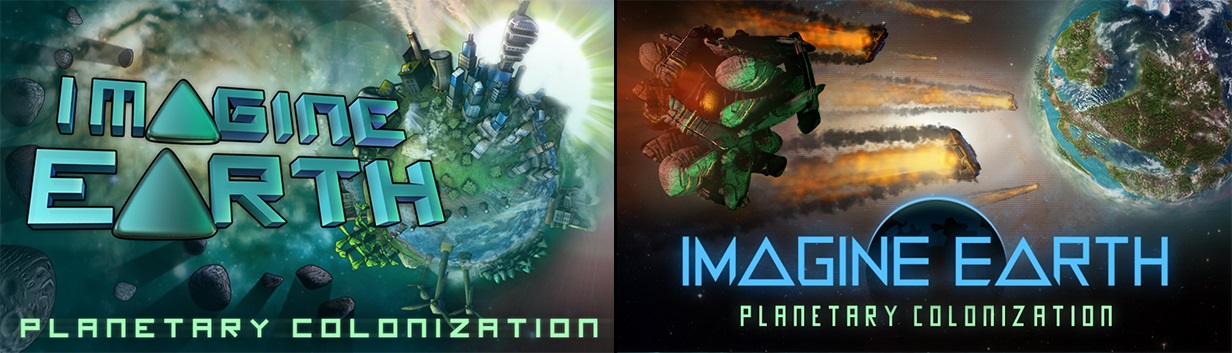
New Steam Graphics
The graphics on Steam were a bit outdated and still had the old logo. So it was time to recreate them from scratch and now they look much more appealing (left: old; right: new):
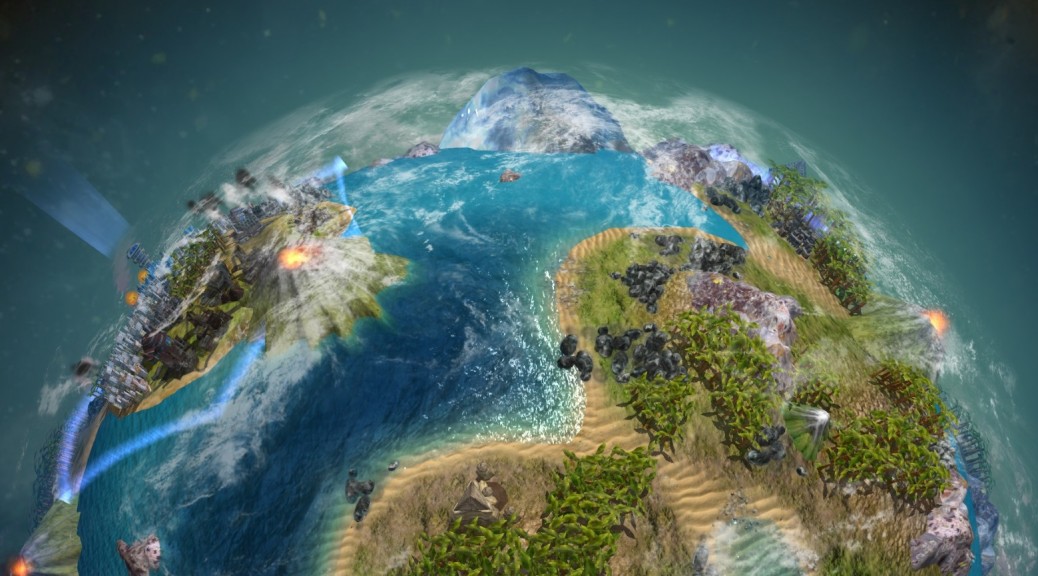
Clouds
Next, Jens realized that the clouds on our planets are very important for the overall look of the game. So we did a rework. The result is shown in the post’s header and looks quite beautiful.
Resource Statistics
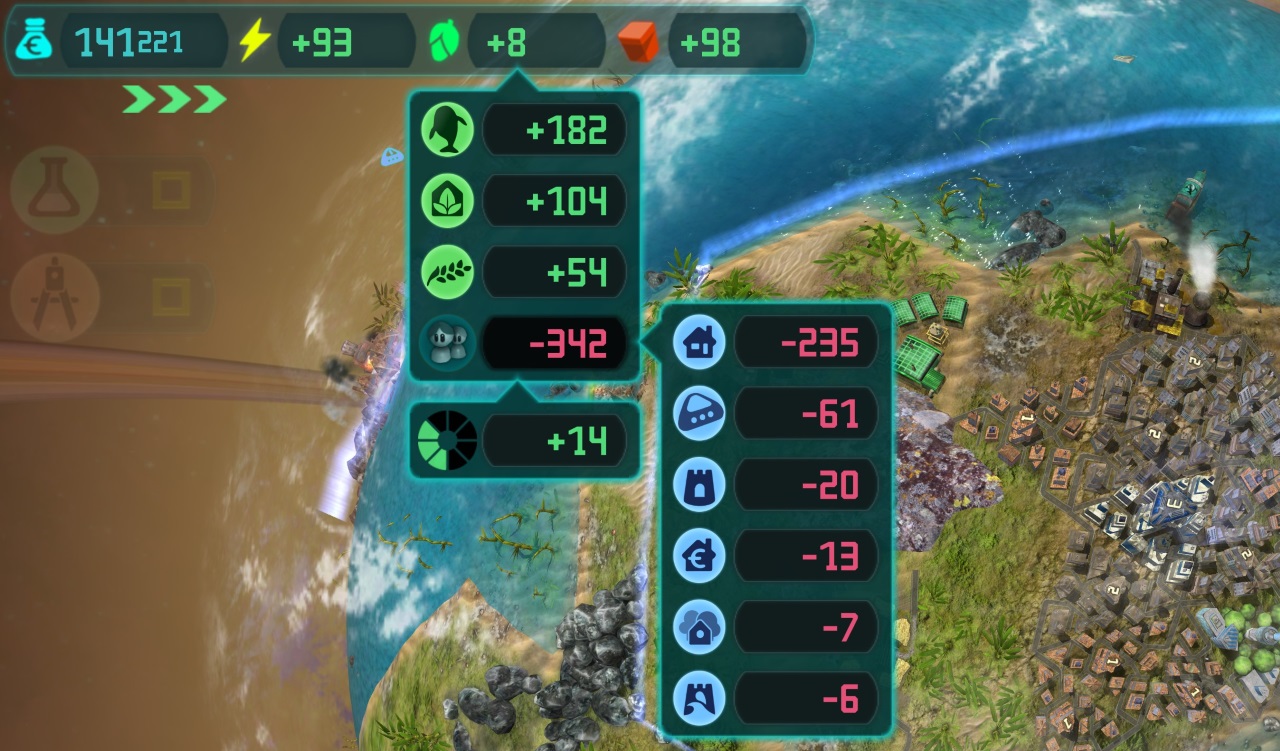
Finally we had to rebuild the complete resource statistics, because they just didn’t work (and feel) right. There was simply too much numbers that made it almost impossible to understand what goes on. The new statistics are much clearer (at least we think so).
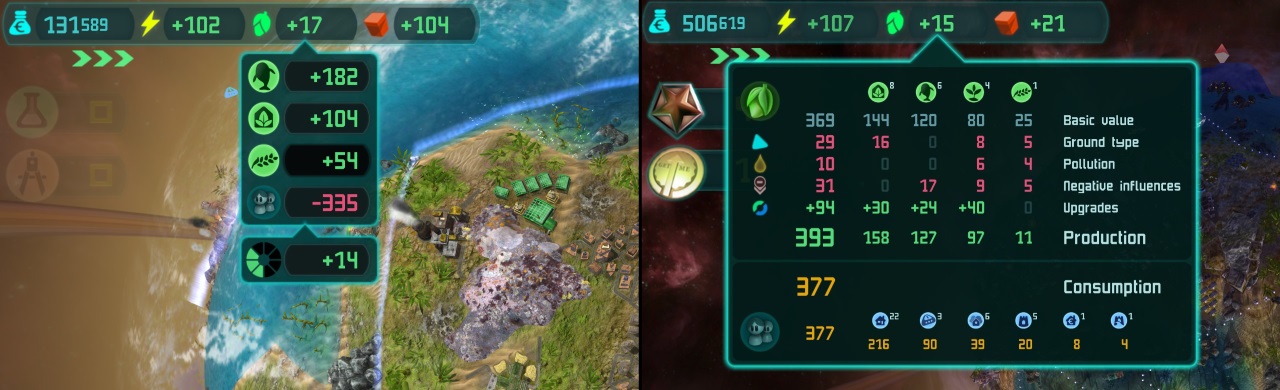
The image on the left shows the new statistics for the production of food compared to the old version on the right. The first three entries are the producing buildings. The fourth entry is the sum of consumed food. You can hover this entry to find out how much every city building type is consuming:
In addition you can hover any of the producing building types (here: industrial farm) to get some details on the base production and the influence of field types, neighboring buildings and pollution on the amount of produced food.